I guess I’m a visual learner.
Back in 2002, I was studying aeronautics at Imperial College, London. My project: analyze the flow of air inside a double-sided cavity. This research would provide the basis for better understanding ventilation in cars, specifically, what happens when you’re driving with your windows open?
I was always fascinated by the phenomenon: it’s hot, so you roll down the windows, and for some reason, it never really gets any cooler, and if you have long hair, you end up with the most tangled hair you’ve ever had in your life. What the heck?
Long story short: I never finished that research, but I do still have some of the pictures and video that I recorded while I was doing it. For me, the visuals that I took were key to me understanding what was happening, in much the same way that a bar graph or scatter plot is to me today.
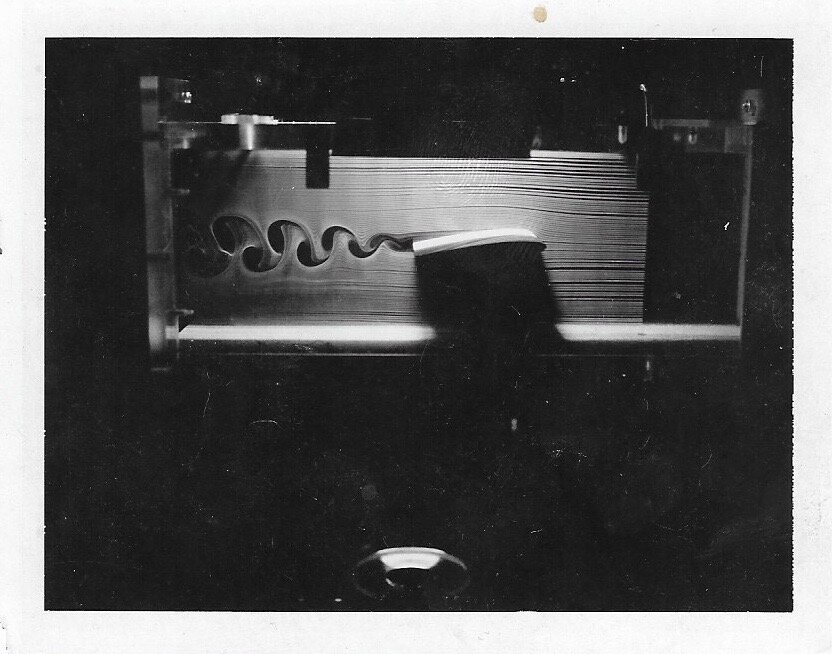
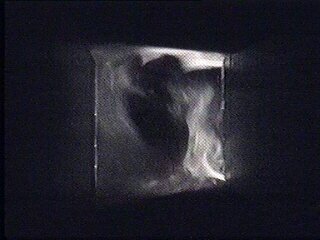
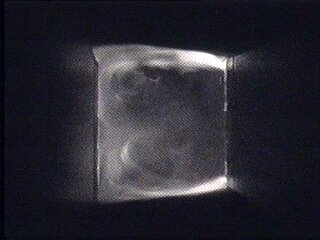
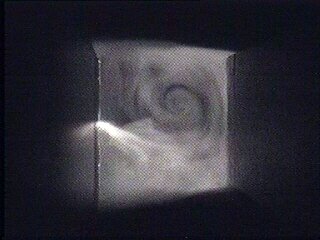
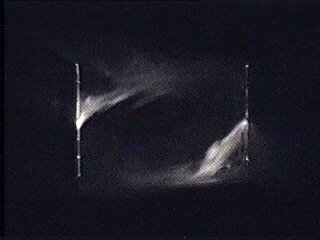
I’ll give you a quick (non-peer-reviewed) summary of my findings, and then leave you with some pretty pictures. Basically, the flow works like this: in a double-sided cavity, the flow switches between three distinct modes:
A single, rotating eddy
A single eddy, rotating in the opposite direction
A double eddy
The switching mode appears to be random. And, of course, this study was effectively only two-dimensional because it was done in an aerofoil whose length was sufficiently long to be considered “infinite”. Things probably look a little different in a three-dimensional car with constraints in the third dimension.
Techniques and neat things
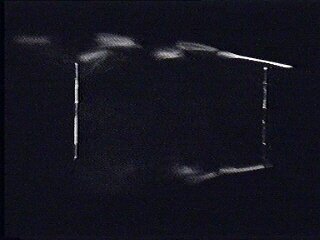
I did this study using smoke-flow visualization, and eventually intended to use particle image velocimetry to visualize the flow. Both things are incredibly cool and you should learn about them.
Also, this study had the distinct honor of combining a whole bunch of my loves before I knew I loved them: flow viz, data viz, and even a little bit of acoustics: another part of the study had me using tiny microphones to measure surface air pressure. It would be more than a decade later that I’d come back to audio, and now I do it every day.
Science, man, science.
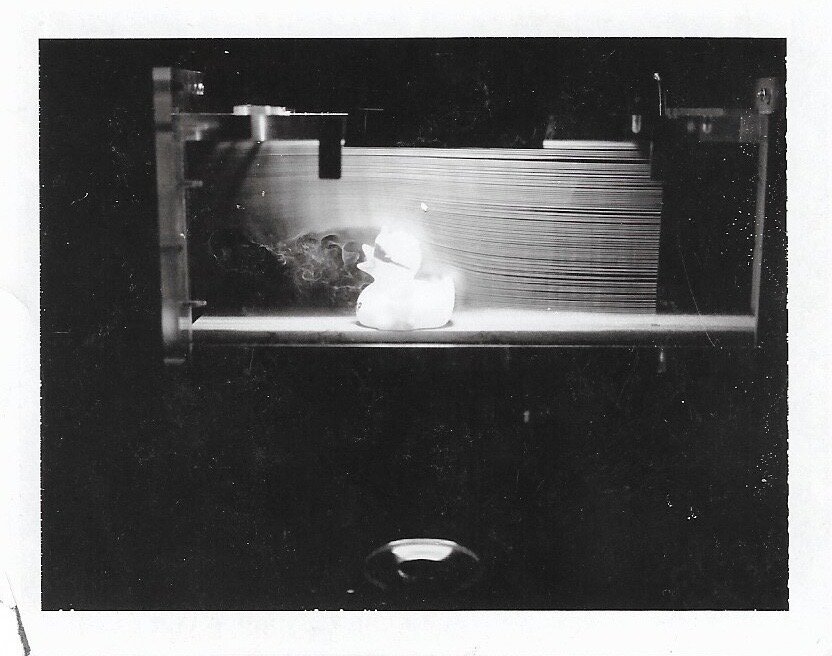
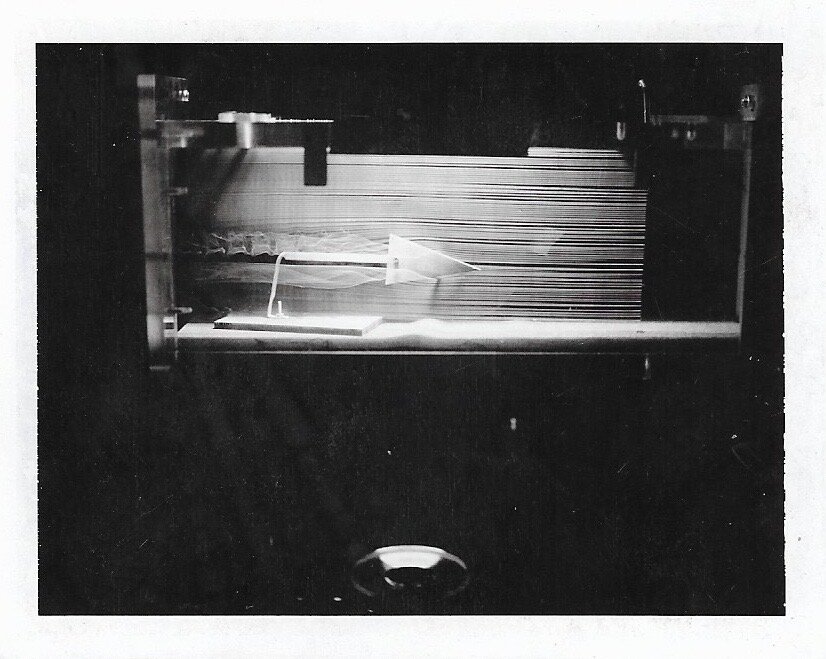
And just for an added bonus, a few more smoke-flow visualization images that I collected at some point (but I can’t remember where). I found these prints (!) at the bottom of a memory box. Apparently rubber ducks aren’t very aerodynamic: