
I’m still new to Tableau (or any modern visualization software, for that matter). I’ve worked exclusively in Microsoft Excel (and then its copycat, Google Sheets) since, oh, 2006? So I’m finding that there’s a disconnect about what I know I what to show, and what I know how to show, at least right now. In order to combat that, I decided to pare it back and go for impact, by designing a simple, yet impactful story for Instagram.
Instagram is an interesting platform, and presents a challenge when you’re trying to get across specific information. Instagram is built for mobile, which means: small screen. Giant infographics won’t cut it here because you can’t really zoom in to read details. But what you can do is take a follower on a journey by posting multiple images in one post and encouraging them to swipe through. Tableau’s story mode is good for designing this way (although I haven’t found a great solution for exporting the story).
What did I analyze?
I grabbed a table of gross domestic box office numbers for the calendar year 2019, from Box Office Mojo from IMDbPro. I copied and pasted into a Google Sheet (which parsed beautifully, thank goodness), and saved into a .csv for importing into Tableau.
How did I present the data?
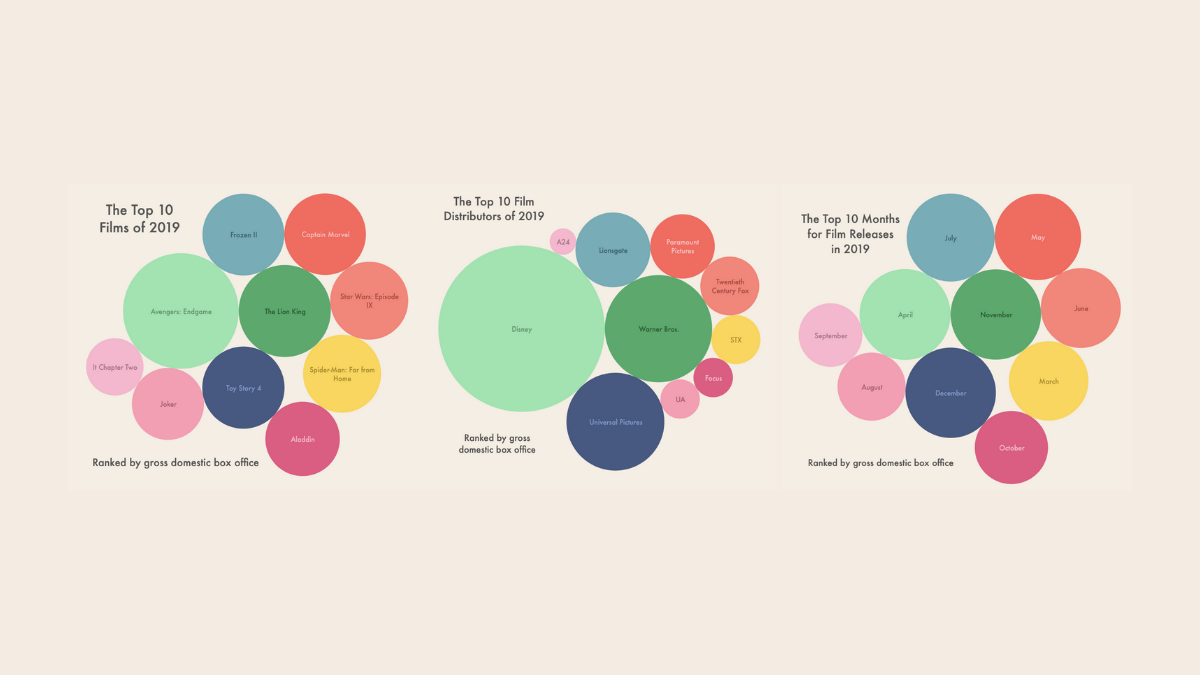
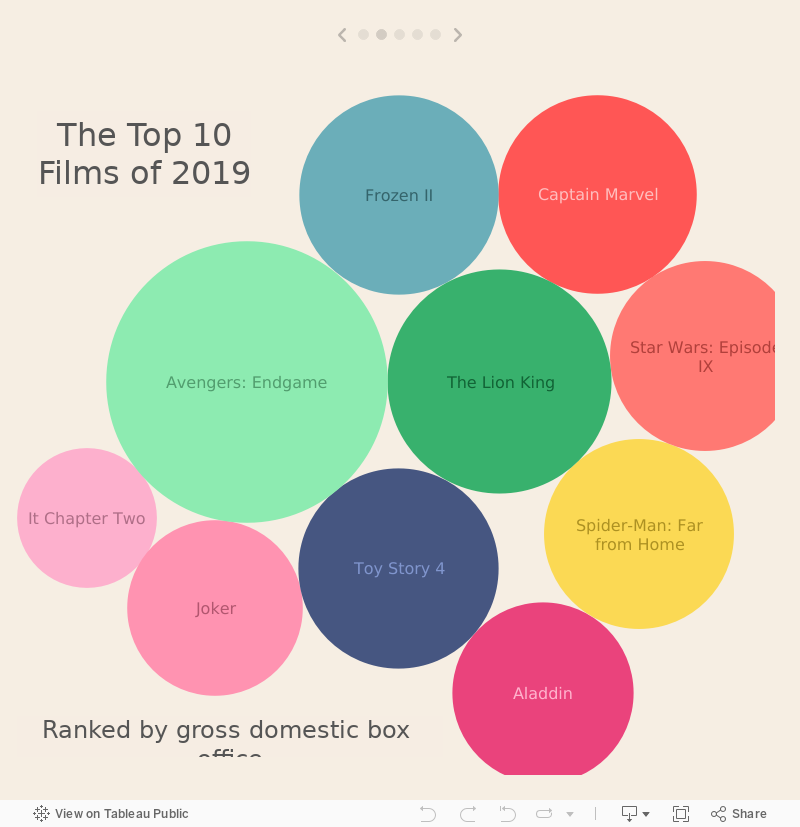
I opted for a packed bubble chart, for no better reason than it looked impactful and, paired with a title and labels, I knew it would be instantly understandable. No particular insights in this viz, just straight presentation of data.
Getting the chart for the top distributors was the most challenging, since many of the releases for the year did not have named distributors in Box Office Mojo’s data set. When you sum by distributor, these releases together ended up being the “top” distributor for the year. I learned that you can both manually select values in a set and you can apply a “top x” to the set and use that as a filter to show the top distributors by gross domestic box office.
How did I publish the viz?
On Tableau Public, and on Instagram. I mentioned earlier that I couldn’t find a way to easily export a story to multiple images (which is a shame!) but instead I opted for screenshots, edited in Canva. You can explore the interactive viz below, or scroll further for the static images. Enjoy!
A note about color
I applied a custom color palette to this viz. That took two steps:
Finding a color palette to use. Not so easy, especially if you’re not a graphic designer (I am not). For small palettes of 5 colors, or gradients, I recommend Adobe Capture because I like the interface. But for this viz, I needed a 10-color palette, which Coolors supports. Go forth and customize!
Learning how to create custom color palettes in Tableau. It’s easy!
If you’re interested in exploring the palette I used, here it is:

The 10-color vibrant palette I used for the 2019 Films viz