

It’s no surprise that I’m into Star Trek. So what happens when my love of data collides with my fandom?
I make a viz that turns the scripts of my favorite movies into an explorable piece of art.
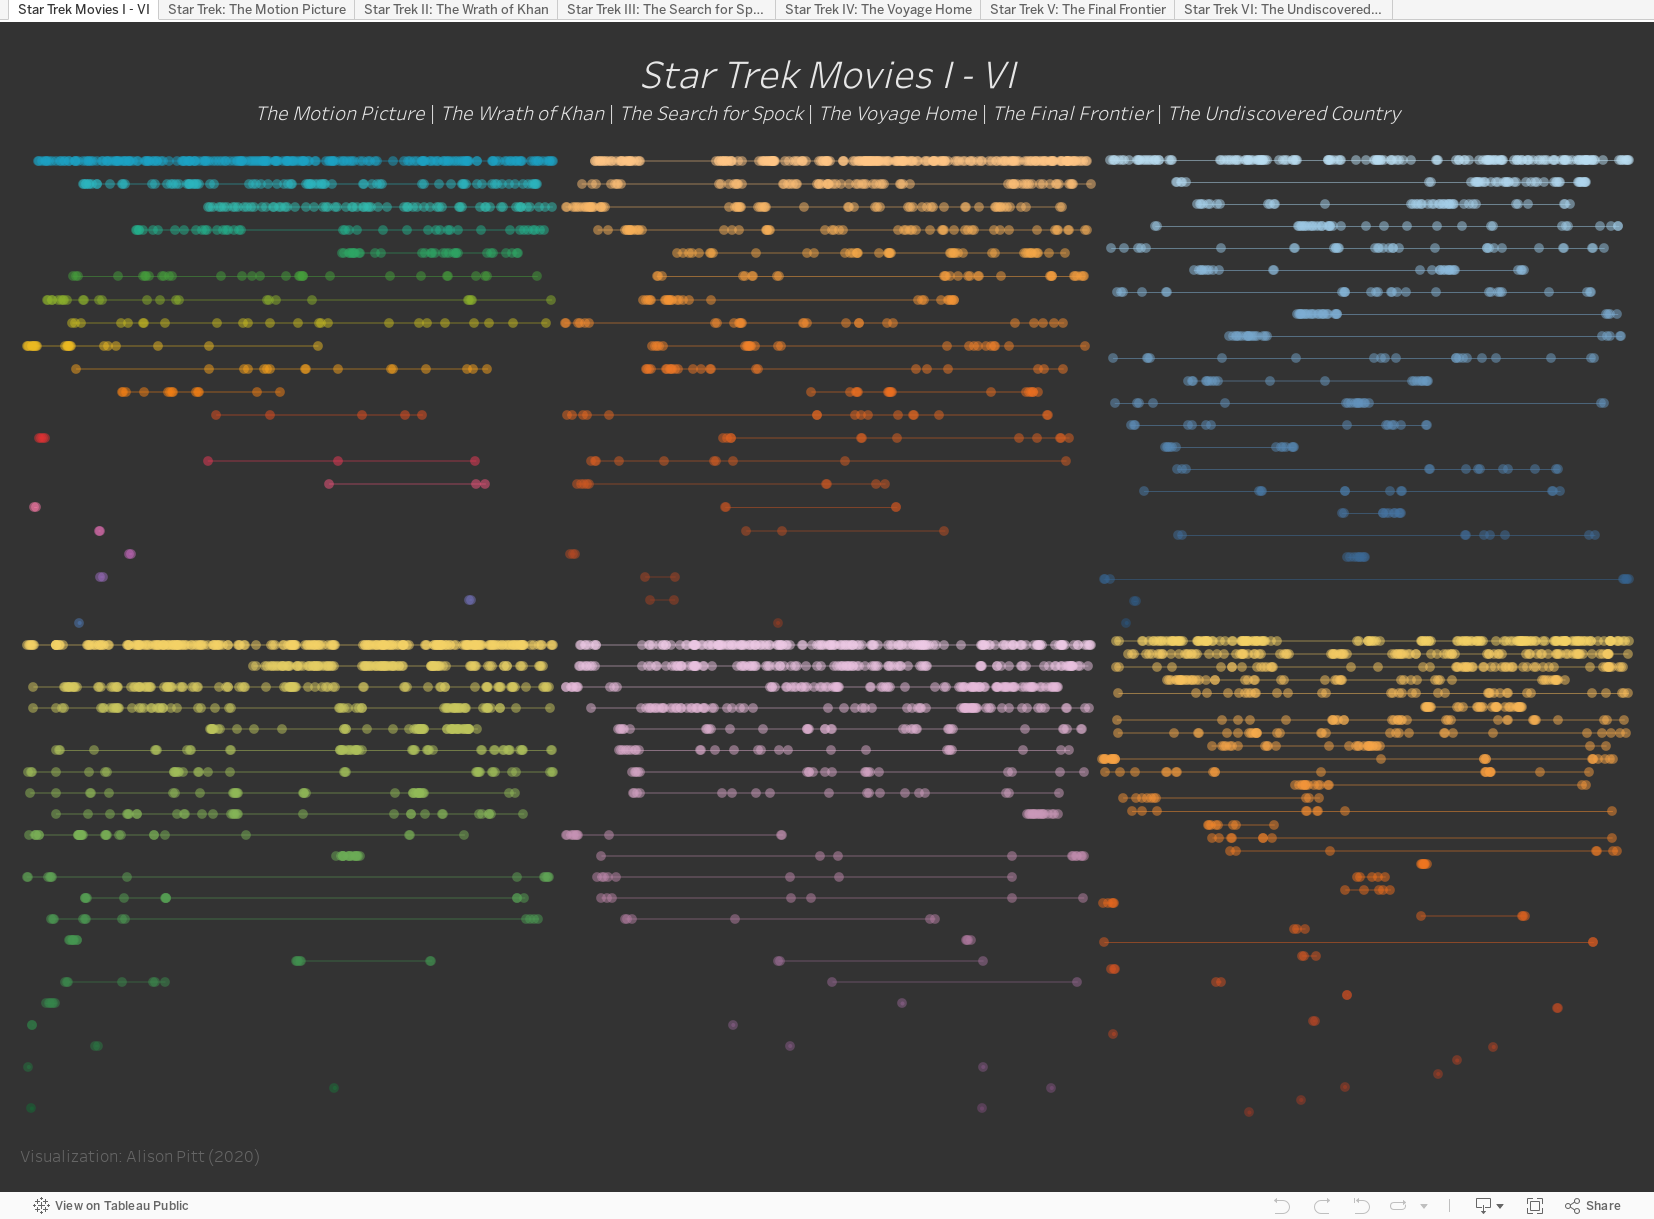
There’s nothing particularly fancy here, and if you want to dive into how I created the charts in Tableau, the best way to do that is to explore the viz in Tableau Public. The two-second version is that it’s several dual-axis charts, with a dot for every line spoken over time.
The data, and parsing it
It is here I must thank heartily chakoteya.net, which is where I pulled the scripts for the films from.
I transformed the scripts into files with ONLY the spoken lines, in the form <SPEAKER>: <SPOKEN LINE>. To do this, I used the truly excellent (and free!) app Orange Data Mining. It’s a well-maintained, open-source data mining and visualization apps, with a variety of available plug-ins. I also used the Textable plugin for the actual parsing.
Orange and Textable are incredibly easy to download, play around with, and eventually use. They have tools that make it easy to inspect what’s going on at each stage of parsing, and I cannot recommend it enough. I would also recommend learning a bit about regular expressions, since that will help in the whole parsing business.
Here’s what my Orange workflow looks like:

My Orange-Textable workflow, from text input to segmentation and display
In human people terms, this is:
Input text
Pre-process text
Segment into lines
Only keep lines in the format <SPEAKER>: <SPOKEN LINE>. I did this with a basic “select ^.*\b(\: )\b.*$”. Which I copied from the internet, which is something I highly recommend when it comes to regexp.
Display the resulting data and save it to a text file
What you’re left with is a cleaned text file that you can bring straight into Excel/Google Sheets/Tableau for analysis.
Timestamping
The scripts I used do not have timestamps. But I wanted a way to work out the cadence, or the feel of the films, without knowing what the actual timestamps were. Also, Tableau is not good at retaining the order of things, like spoken lines, without some kind of index. So I decided to calculate some timestamps myself.
This isn’t perfect! I’d love to have the actual timestamps, so it would be easier to identify, say, the lengthy scene in Star Trek: The Motion Picture when Scotty takes Kirk on a tour around the Enterprise exterior.
Without timestamps, I opted to work out a relative “distance” through the film, by number of characters. Yes, that’s probably wildly inaccurate, but it was easier than words. I did this work in Google Sheets, before bringing the data into Tableau. While I was there I also went ahead and did the line splitting in Google Sheets too, just to save me a step later.

Manual calculations to split speakers and spoken lines, and work out timestamps in Google Sheets
Once I had all that information, I brought it into Tableau and with just a bit of cleanup (grouping some speakers and filtering out the errant script notes), I plotted it all out.
A note about colors
The color choices on the vizzes are deliberate, chosen to delineate the films and hopefully jibe well with the posters for each film. More or less. The exception, of course, being Star Trek IV: The Voyage Home aka “The One with the Whales”, which I always thought of as green because of the Klingon Bird of Prey.

Star Trek movies I-VI